Q2 / June Market Update
The countdown to 2020 is already here. 2019 is HALFWAY over already, and if you’re like me, you’re wondering where March went. The market has continued to shape into its new normal, and we are seeing a little bit of a bounce up in terms of values. Here is the Market Update for June and for the 2nd Quarter of 2019. Prefer to watch the video? I break down the market in about 4 mintues!
Sales Price
After 4 of the last 5 months stuck at $300,000, the Median Sales price for June ticked up to $304,000. We are up about 4% from June of 2018, and up about 2.6% since the beginning of the Year. If you’ve watched my videos are read my blog posts in the past, I have said to expect gains to be about 3-5% for 2019, and it looks like we’re in that range! In fact, we’ve been in a range of $9,000 for Median prices since May of 2018, so for the last 13 months, we’ve remained relatively flat with a slight uptick.
The Average Price, which of course moves more violently month to month, was just under $354,000 for June, an increase of 4.3% Year over Year, but down from May, and up about 2% since the start of the year.
Inventory
We had about 8,880 homes on the market available for sale as of June 30th. This is a 39% increase from the same point last year, and part of the reason we have started this horizontal move in terms of value. There are simply more homes available. If we compare this number to our bottom in February 2018, we have about 3200 MORE homes available now than we did then. Just look at this chart!
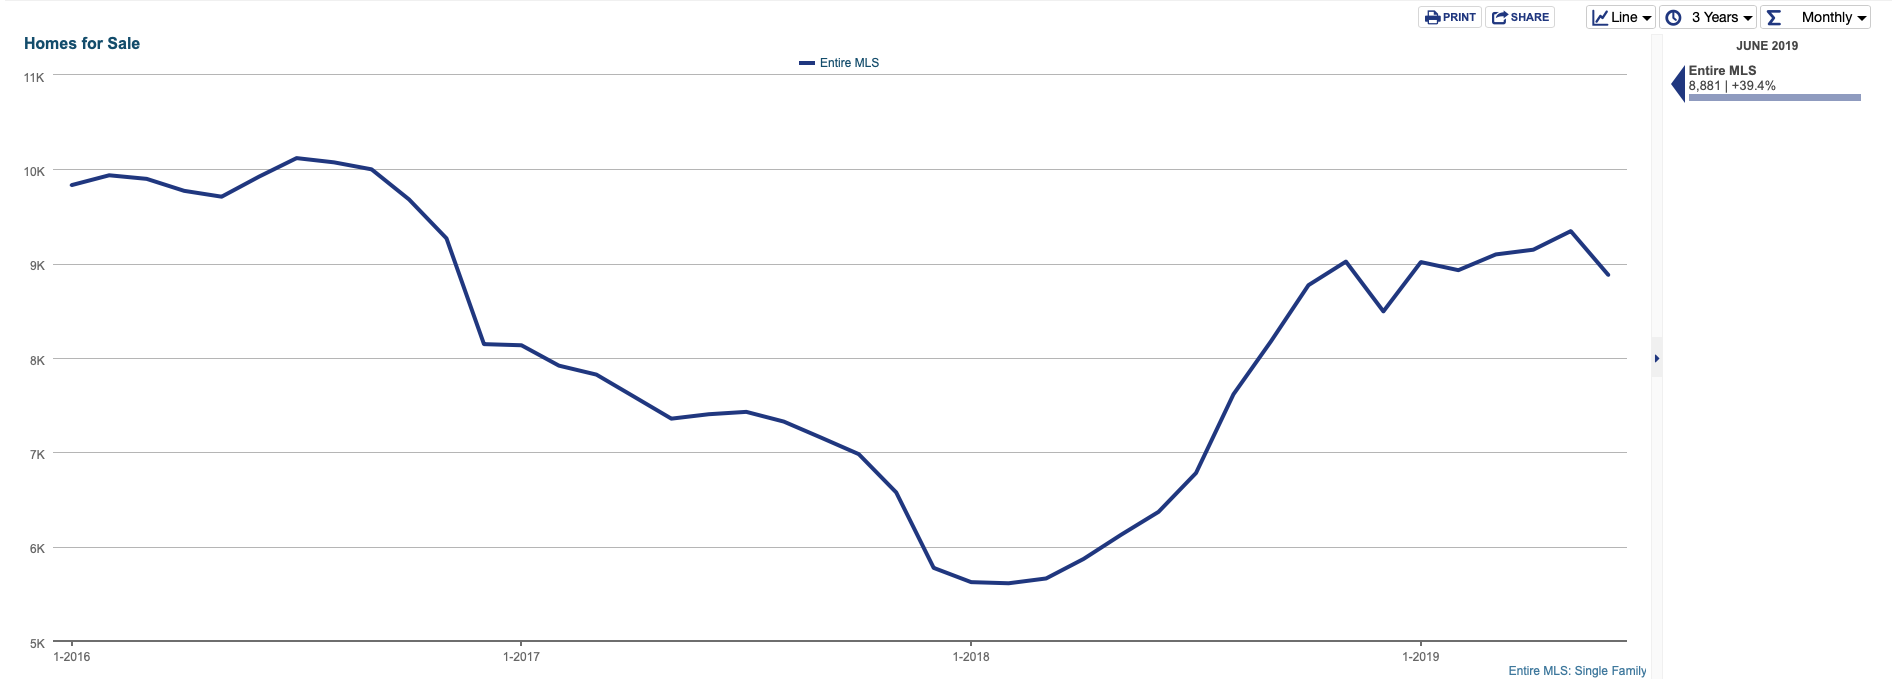
Inventory Levels have risen since 2018, but are starting to reach a stabilization point.
Days on Market
Another stat that I constantly look at is how long homes are taking to sell. We have seen an uptick here as well, but the Summer Selling season is helping things. Our current Median Days on Market is 23 days. That is up an astounding 91.7% from the same time last year, when homes were selling in 12 Days. To compare, July 2018 was the lowest Days on Market in over 10 years, at 11 Days. So 23 Days seems like a crazy amount of time, but we are actually still in a low trough compared to the 10 year data. Also, we are down 10 days since January, when we hit 33 Days on Market. The Average Days on Market is seeing a similar trend. While we are at 40 Days on Market, which is 48.1% more than June of 2018, we are down from a high in February of 49 Days. These numbers do tend to be seasonal, and I would anticipate us seeing an uptick again here in September or October, but wouldn’t be surprised if Median and Average decline again in July and August.
Months Supply of Inventory
My favorite stat to finish with is our Monthly Inventory. This is, as always, the number of months it would theoretically take for us to sell all the homes on the market if NO new homes were allowed to be placed for sale; also called the Absorption Rate. 6 Months is known as being a Neutral Market, where it’s not favored to a Buyer or Seller. More than 6 Months is considered a buyer’s market, and less than 6 months is considered a Seller’s Market. This is somewhat known for the entire country. I tend to feel that 5 months is a “neutral market” as Vegas is a different market than many other areas. For June, we were at 3.4 Months of Inventory. This is UP 47.8% since June of 2018, when we were sitting at only 2.3 Months of Inventory. However, as I have said with many of the stats, we are seeing a stabilization occurring in our market, and our last 10 months have fluctuated between 3.0 and 3.5 months of inventory. So I would call us still firmly in a Seller’s market, however, compared to last year, when we had as low as 1.9 Months of Inventory (in February 2018), some people are seeing/feeling the shift in the market. In case you’re interested, during the height of the Short Sale / Foreclosure process here in Las Vegas, we peaked at 8.2 Months of Inventory in November of 2010. November of 2014 was the last time we had more than 5 months of Inventory.
Looking Ahead
I still think 2019 is a 3-5% growth in terms of Median Price. If that’s the case, I see us ending December with a Median Price for Single Family homes in the $305,000 to $311,000 range. I think our inventory levels remain in the mid 3 month range, for the next 12 months as well, and I think our inventory hovers on a monthly basis between 8500 - 9000 homes the next few months. Let me know what you think!